Bench Results and Observations Based on an idea from Daniel Sandu YO3GJC, Inrad has taken their stock series of 9MHz filters and fitted them to a daughter card allowing drop-in use in the Yaesu FT-dx5000 series rigs. Here we take a look at how these Inrad filters measure up to their Yaesu alternatives. On The BenchBelow is a bench test comparison of the stock Yaesu 3000 Hz filter (blue plot) and the Inrad 2100 Hz (red plot). The Inrad 2100 Hz filter is about 2300 Hz wide at the -6 dBc point. The insertion loss of this filter is slightly less than the Yaesu filter. The ultimate attention of the Yaesu is better and that may be a factor for guys facing an image rejection issue at certain frequencies. 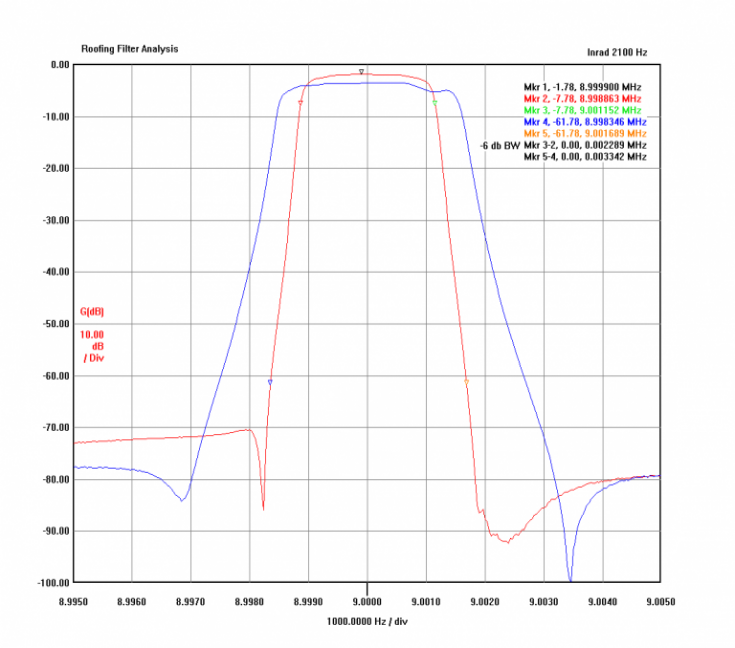
Other Inrad filters were tested, with these widths: Filter | -6 dB bandwidth | Yaesu 3000 | 3140 Hz | Inrad 2400 | 2520 Hz | Inrad 2100 | 2300 Hz | Inrad 1800 | 1940 Hz |
Plots of the Inrad 1800 and Inrad 2400 are shown below. Insertion loss was about the same among the 3 Inrad filters; the Yaesu ran about 2 dB more loss. All filters measure somewhat wider than their optimistic labels suggest. For DX/contest use, I judge the Inrad 2100 as being the best overall choice in that it's a good match with the default 2.40 KHz DSP width. Filter | -6 dB Bandwidth | Yaesu 600 | 640 Hz | Inrad 500 | 580 Hz |
Insertion loss of the Inrad 500 was about 3 dB more than the Yaesu 600. All things being equal, signals (or amplification) must be 3 dB stronger and that means the DR3 is degraded by 9 dB as a result. I do not believe that the slight improvement in bandwidth outweighs the loss and implied DR3 impact. The Yaesu 300 Hz filter measures about 315 Hz bandwidth, and has considerably lower loss than the Inrad 250 Hz filter. The Inrad measured wider than the Yaesu and along with the significantly higher loss is potentially why Inrad has not offered this filter for sale. Inrad 1800 vs. Yaesu 3000 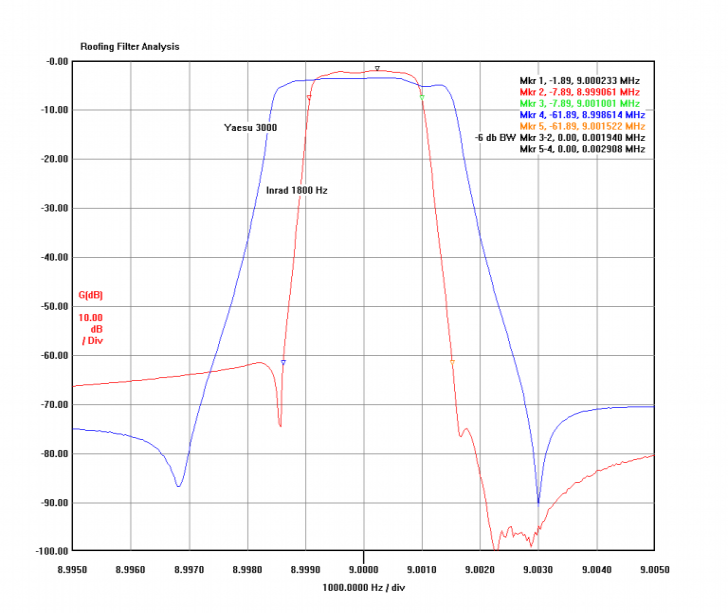
Inrad 2400 vs. Yaesu 3000 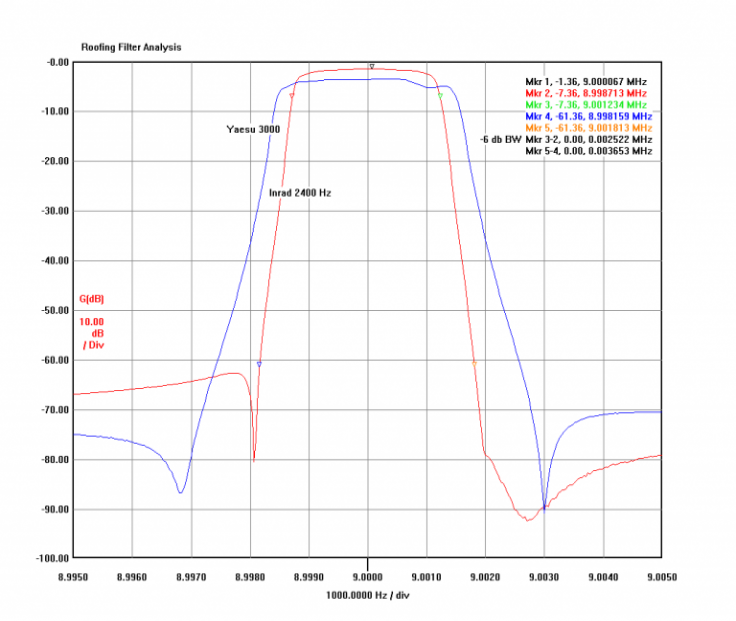
AF Spectrum AnalysisAnother way to look at the filter is to sweep a signal on the rig's input, and look at the AF, plotting the spectrum. The advantage of this method is you get a complete in-system response curve. The disadvantage is that a lot of things want to get in the way and complicate the data (AGC, RF or AF chain overload, shack noise, etc). Here's what the plot looked like from this AF sweep. There are two sets of data here. First, the right side tags show two roofing filter shapes with the DSP set at 4.0 KHz (so that the DSP is not affecting the plot). The red color is the stock Yaesu 3000 Hz filter; the black color is the Inrad 2100 Hz filter. Next, on the left side, we are looking at the combined response of the Inrad 2100 Hz filter, along with various bandwidths of the DSP. For this test, the DSP menu was set to SHARP/STEEP. 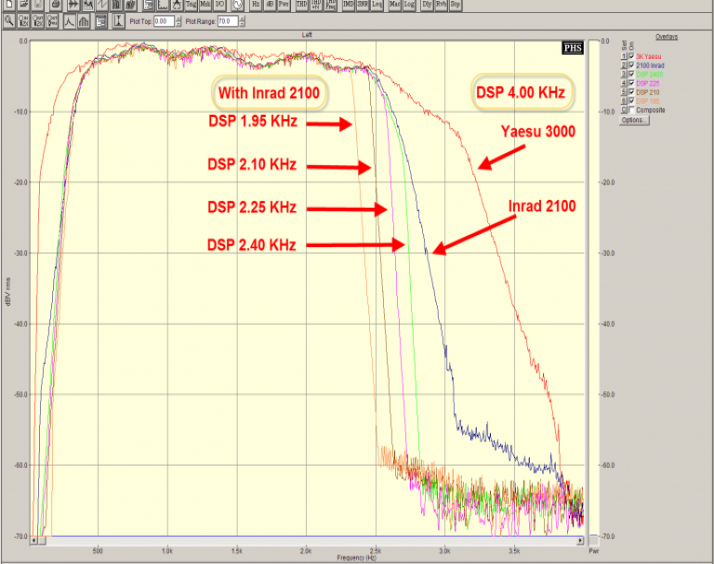
|